Making decisions related to investment of funds is an important stage in the activities of any enterprise. To effectively use raised funds and obtain maximum return on invested capital, a thorough analysis of future income and costs associated with the implementation of the investment project under consideration is necessary.
The task of the financial manager is to select such projects and ways of their implementation that will provide a cash flow that has the maximum present value compared to the cost of the required capital investment.
There are several methods for assessing the attractiveness of an investment project and, accordingly, several key performance indicators. Each method is based on the same principle: as a result of the implementation of the project, the enterprise should make a profit (the enterprise’s equity capital should increase), while various financial indicators characterize the project from different angles and may meet the interests of various groups of people related to this enterprise - creditors, investors, managers.
When assessing the effectiveness of investment projects, the following main indicators are used:
Payback period - PP (Payback Period)
Net Present Value – NPV (Net Present Value)
Internal rate of return –IRR (Internal Rate of Return)
Profitability Index – PI (Profitability Index)
Each indicator is at the same time a decision-making criterion when choosing the most attractive project from several possible ones.
Payback period of the project pp (Payback Period)
The payback period is defined as the expected number of years required to fully recover investment costs. The payback period is calculated as follows:
T OK = number of years preceding the payback year + Unrecovered cost at the beginning of the payback year / Cash inflow during the payback year
Calculated using the formula:
Where: T OK – payback period for project costs (investments) CFt – cash flow from the investment project in period t; I 0 - initial costs; n – sum of the number of periods.
This indicator determines the period during which investments will be “frozen”, since real income from the investment project will begin to flow only after the payback period. When selecting options, preference is given to projects with the shortest payback period.
It is advisable to calculate the “payback period” indicator for projects financed through long-term obligations. The payback period for the project must be shorter than the period for using borrowed funds established by the lender.
The indicator is a priority in that if the main thing for an investor is the fastest possible return on investment, for example, choosing ways of financial recovery of bankrupt enterprises. The disadvantages of this indicator are as follows
First, the calculations ignore income received after the proposed payback period of the project. Consequently, when selecting alternative projects, serious miscalculations can be made if we limit ourselves to using only this indicator.
Secondly, using this indicator to analyze the investment portfolio as a whole requires additional calculations. The payback period for the portfolio as a whole cannot be calculated as a simple average.
Net present value – npv (Net Present Value)
NPV - net present value - is the present value of future cash receipts discounted at the market interest rate, minus the modern assessment of the cost of investments. We can say that NPV is the difference between the expected inflow of funds received as a result of project investments and the expected outflow of funds.
NPV = PV/I
PV - Discounting (Present Value)- this is the determination of the value of cash flows relating to future periods.
![]()
NCF (Net Cash Flow) - Net cash flow (orR 1 + R 2 + R 3 – annual cash receipts duringnyears)
r - discount rate
n - period of the analyzed project
i - calculation step (month, quarter, year), i=1, 2, ...,n
The criterion for project acceptance is a positive NPV value. In cases where it is necessary to make a choice from several possible projects, preference should be given to the project with a larger net present value. (A positive net present value means that the current value of income exceeds investment costs and, as a result, provides additional opportunities to increase the wealth of investors. A zero net present value is an insufficient basis for deciding to implement an investment project.)
At the same time, a zero or even negative NPV value does not indicate the unprofitability of the project as such, but only its unprofitability when using a given discount rate. The same project implemented by investing cheaper capital or with a lower required return, i.e. with a smaller value of i, can give a positive net present value.
Advantages and disadvantages of the net present value (NPV) indicator The advantages of net present value include:
clarity of the indicator for management decisions when choosing an investment object;
the use of a discount rate reflects the property of the value of money to depreciate;
The discount rate may include additional project risks.
Disadvantages of net present value include:
the complexity of calculating the discount rate can distort the results of assessing the NPV indicator.
difficulty in forecasting cash flows. Although the cash flows of the enterprise are determined, these are only forecast values that may change in the process;
failure to take into account the intangible advantages and values of the enterprise.
The concept of "net present value" usually pops up in consciousness when it is necessary to evaluate the feasibility of certain things.
There are mathematically based theses that involve the concept (pure) and which are worth sticking to whenever you have the idea of \u200b\u200bforking out for this or that.
To understand what is net present value, we will analyze in detail a specific (hypothetical) example.
To do this, we will have to recall some basic information related to the topic of present value, which we already discussed on the pages.
So, an example.
Net Present Value: Introduction
Suppose you inherited a plot of land worth 23 thousand dollars. Plus, there are about 280 thousand “green” lying around in your accounts.
Total - 303 thousand dollars, which would be nice to put somewhere.
An investment option looms on the horizon, the price of which, as experts suggest, should skyrocket in a year.
Let’s assume that the cost of constructing a certain building is $280 thousand, acceptable to us, and the expected selling price of an already completed building is about $330 thousand.
If it turns out that the present value of $330,000 is greater than the amount of money you spent ($280,000 + $23,000 = $303,000), then you should agree to the proposal to build the facility.
In this case, the difference between both quantities will be the very net present value that we are so striving to find.
To begin with, however, we will have to deal with intermediate calculations aimed at establishing the present value.
How to calculate present value
Obviously, the $330 thousand that we will receive in the future is worth less than the $330 thousand that we have today. And it's not just about .
The main reason for this state of affairs is that we can invest the available 330 thousand dollars in risk-free instruments like banking or government ones.
In this case, to determine the “true” value of our 330 thousand dollars, it is necessary to add to them the income on the corresponding deposit ().
You can look at this situation like this: today's 330 thousand dollars will cost the same amount in the future plus interest income on risk-free financial instruments.
We are very close to understanding one of the most important theories: TODAY are worth EXPENSIVE than the money we get TOMORROW.
This is why the present value of any future income will be LESS its nominal value, and to find it, you need to multiply the expected income by some, obviously LESS units.
This coefficient is usually called discount factor.
To do this, let us introduce into the problem conditions the interest rate on risk-free financial instruments, equal to, for example, 8 percent per annum.
In this case, the discount rate will be equal to the value of the fraction 1 / (1 + 0.08):
DF = 1 / (1 + 0.08) = 1 / 1.08 = 0.926.
We calculate the present value of 330 thousand dollars as follows:
PV =DF*C 1 = 0.926 * $330,000 = $305,580.
Opportunity Cost
Now let's remember what we were talking about at the beginning of our conversation.
If the size of our investment turns out to be less than the present value of the income we expect, then the corresponding offer is PROFITABLE, and it should be accepted.
As you can see, $303,000.< 305 580 долл., а значит, строительство офиса на нашем участке (скорее всего) окажется вложением…
What we have just done sounds like this in the language of finance: discounting future income at a rate that other (alternative) financial instruments can “offer.”
The indicated rate of return can be called differently: profitability ratio, discount rate, marginal return, opportunity cost, opportunity cost.
All marked options are equally used, and their choice depends on the context.
It is worth paying attention to the term "opportunity cost", since it emphasizes the very essence of the current value of money, income, etc.
You'll just carry LOSSES, equal to opportunity costs.
About all this (and more) another time.
Additional information on the topic is presented in the articles:
1. ,
2. .
Happy investment!
Net Present Income ( NPV). It shows the final effect of investing in a project in absolute terms (in monetary terms).
NPV is the difference between the amount of cash flow from the project reduced to the present value (by discounting - NPV), and the amount of funds invested in the project, also given at present value (if the investment is carried out over several years - CHI).
Thus, all cash flows from investing in a project are reduced to the year in which the investment began. If the investment process is carried out within one year, then IS = CHI.
Net investment ( CHI) is the amount of funds invested in the project ( IP), reduced to present value
NPV is the difference between the amount of net cash flow (which consists of the discounted increase in net profit and the increase in depreciation charges for the analyzed period of time) and the amount of net investment funds allocated for the implementation of the project.
NPV= ∑ NDP – CHI
This indicator is used either to assess the comparative effectiveness of several projects, or as a criterion for the feasibility of implementing a specific project. If the indicator value NPV less than zero for a certain period of time, then this project is considered inappropriate (it will not bring the investor the planned return on invested capital). If the value NPV is greater than zero or equal to zero, then this project will allow the investor to receive the planned income on the invested funds.
When calculating NPV, all cash flows (IS and DP) must be led to initial period of investment, i.e. discount.
For example: The construction of plant A is carried out within three years:
During the first year, 20 thousand were spent. Unit
during the second - 130 thousand den and
during the third – 75 thousand.
From the implementation of the project, the expected cash flow over five years (from the fourth year from the moment of the first cash investment) is 88 thousand den. Determine the feasibility of construction.
To solve this problem, let's draw a cash flow diagram:
0 1 2 3 4 5 6 7 8 years
IP-20 -130 -75
DP +88 +88 +88 +88 +88
The diagram shows two cash flows: negative, associated with the investment of funds for the construction of the plant, and positive, income from the results of the enterprise’s activities. Further, in order to be able to compare these flows with each other, they must be brought to a zero period (as shown by arrows) by discounting and the feasibility of investing must be determined using the NPV indicator.
Let's consider how, from the three available alternative options for an investment project, it is possible to choose the best one if the discount rate is, respectively, equal to: 13%, 14%, 10%
Calculation of the efficiency of investing funds in investment projects
|
Indicators |
Investment projects | |||||
|
1. Volume of investment ( IP), thousand US dollars | ||||||
|
2. Operating period investment project | ||||||
|
3. Total DP amount | ||||||
|
incl. on years: | ||||||
|
solution | ||||||
|
Discount rate,% | ||||||
|
Discount multiplier by year: | ||||||
|
Present cost of the project (NPV) thousand dollars. | ||||||
|
incl. on years: | ||||||
|
I T O G O NDP (drive) | ||||||
|
NPV= NPV - IS , thousand dollars | ||||||
|
ID= NPV /IS |
0.969775 |
1.0176818 | ||||
|
ChDP (1 lane) | ||||||
|
BY- payback period = IS/CHDP(1 lane) | ||||||
Therefore, as a result of comparison NPV Among the three projects, the most attractive is project A.
Let's calculate the Net Present Value and Internal Rate of Return using the formulasMSEXCEL.
Let's start with a definition, or rather with definitions.
Net present value (NPV) is called the sum of discounted values of the payment stream reduced to today(taken from Wikipedia).
Or like this: Net present value is the current value of future cash flows of an investment project, calculated taking into account discounting, minus investments (websitecfin.ru)
Or like this: Currentthe cost of a security or investment project, determined by taking into account all current and future income and expenses at the appropriate interest rate. (Economy .
Dictionary . -
M .
: "
INFRA -
M ",
Publishing house "
The whole world ".
J .
Black .)
Note1. Net present value is also often called Net Present Value, Net Present Value (NPV). But, because the corresponding MS EXCEL function is called NPV(), then we will adhere to this terminology. In addition, the term Net Present Value (NPV) clearly indicates a connection with.
For our purposes (calculation in MS EXCEL), we define NPV as follows:
Net present value is the sum of cash flows presented in the form of payments of arbitrary amounts made at regular intervals.
Advice: when first becoming acquainted with the concept of Net Present Value, it makes sense to get acquainted with the materials of the article.
This is a more formalized definition without reference to projects, investments and securities, because this method can be used to evaluate cash flows of any nature (although, in fact, the NPV method is often used to evaluate the effectiveness of projects, including for comparing projects with different cash flows).
Also, the definition does not contain the concept of discounting, because The discounting procedure is, in essence, the calculation of present value using the method.
As mentioned, in MS EXCEL, the NPV() function is used to calculate the Net Present Value (NPV()). It is based on the formula:
CFn is the cash flow (money amount) in period n. The total number of periods is N. To show whether a cash flow is an income or an expense (investment), it is written with a certain sign (+ for income, minus for expenses). The value of cash flow in certain periods can be =0, which is equivalent to the absence of cash flow in a certain period (see note 2 below). i is the discount rate for the period (if the annual interest rate is given (let it be 10%), and the period is equal to a month, then i = 10%/12).
Note2. Because cash flow may not be present in every period, then the definition of NPV can be clarified: Net present value is the present value of cash flows presented in the form of payments of an arbitrary value, made at intervals that are multiples of a certain period (month, quarter or year). For example, initial investments were made in the 1st and 2nd quarters (indicated with a minus sign), there were no cash flows in the 3rd, 4th and 7th quarters, and in the 5th, 6th and 9th quarters revenue from the project has been received (indicated with a plus sign). For this case, NPV is calculated in exactly the same way as for regular payments (amounts in the 3rd, 4th and 7th quarters must be indicated =0).
If the sum of the given cash flows representing income (those with a + sign) is greater than the sum of the given cash flows representing investments (expenses, with a minus sign), then NPV > 0 (the project/investment pays off). Otherwise NPV<0 и проект убыточен.
Selecting the discount period for the NPV() function
When choosing a discount period, you need to ask yourself the question: “If we are forecasting 5 years in advance, can we predict cash flows with an accuracy of up to a month / up to a quarter / up to a year?”
In practice, as a rule, the first 1-2 years of receipts and payments can be predicted more accurately, say monthly, and in subsequent years the timing of cash flows can be determined, say, once a quarter.
Note3. Naturally, all projects are individual and there can be no single rule for determining the period. The project manager must determine the most likely dates for the receipt of amounts based on current realities.
Having decided on the timing of cash flows, for the NPV() function you need to find the shortest period between cash flows. For example, if in the 1st year receipts are planned monthly, and in the 2nd year quarterly, then the period should be chosen equal to 1 month. In the second year, the amounts of cash flows in the first and second months of the quarters will be equal to 0 (see. example file, NPV sheet).

In the table, NPV is calculated in two ways: through the NPV() function and by formulas (calculating the present value of each amount). The table shows that already the first amount (investment) is discounted (-1,000,000 turned into -991,735.54). Let's assume that the first amount (-1,000,000) was transferred on January 31, 2010, which means its present value (-991,735.54=-1,000,000/(1+10%/12)) is calculated as of December 31, 2009. (without much loss of accuracy we can assume that as of 01/01/2010)
This means that all amounts are given not as of the date of transfer of the first amount, but at an earlier date - at the beginning of the first month (period). Thus, the formula assumes that the first and all subsequent amounts are paid at the end of the period.
If it is required that all amounts be given as of the date of the first investment, then it does not need to be included in the arguments of the NPV() function, but simply added to the resulting result (see example file).
A comparison of 2 discounting options is given in the example file, NPV sheet:

About the accuracy of calculating the discount rate
There are dozens of approaches for determining the discount rate. Many indicators are used for calculations: the weighted average cost of capital of the company; refinancing rate; average bank deposit rate; annual inflation rate; income tax rate; country risk-free rate; premium for project risks and many others, as well as their combinations. It is not surprising that in some cases the calculations can be quite labor-intensive. The choice of the right approach depends on the specific task; we will not consider them. Let us note only one thing: the accuracy of calculating the discount rate must correspond to the accuracy of determining the dates and amounts of cash flows. Let's show the existing dependency (see. example file, sheet Accuracy).
Let there be a project: implementation period is 10 years, discount rate is 12%, cash flow period is 1 year.

NPV amounted to 1,070,283.07 (Discounted to the date of the first payment).
Because If the project period is long, then everyone understands that the amounts in years 4-10 are not determined precisely, but with some acceptable accuracy, say +/- 100,000.0. Thus, we have 3 scenarios: Basic (the average (most “probable”) value is indicated), Pessimistic (minus 100,000.0 from the base) and Optimistic (plus 100,000.0 to the base). You must understand that if the base amount is 700,000.0, then the amounts of 800,000.0 and 600,000.0 are no less accurate.
Let's see how NPV reacts when the discount rate changes by +/- 2% (from 10% to 14%):

Consider a 2% rate increase. It is clear that as the discount rate increases, NPV decreases. If we compare the ranges of NPV spread at 12% and 14%, we see that they intersect at 71%.

Is it a lot or a little? Cash flow in years 4-6 is predicted with an accuracy of 14% (100,000/700,000), which is quite accurate. A change in the discount rate by 2% led to a decrease in NPV by 16% (when compared with the base case). Taking into account the fact that the NPV ranges overlap significantly due to the accuracy of determining the amounts of cash income, an increase of 2% in the rate did not have a significant impact on the NPV of the project (taking into account the accuracy of determining the amounts of cash flows). Of course, this cannot be a recommendation for all projects. These calculations are provided as an example.
Thus, using the above approach, the project manager must estimate the costs of additional calculations of a more accurate discount rate, and decide how much they will improve the NPV estimate.
We have a completely different situation for the same project, if the discount rate is known to us with less accuracy, say +/- 3%, and future flows are known with greater accuracy +/- 50,000.0

An increase in the discount rate by 3% led to a decrease in NPV by 24% (when compared with the base case). If we compare the ranges of NPV spread at 12% and 15%, we see that they intersect only by 23%.
Thus, the project manager, having analyzed the sensitivity of NPV to the discount rate, must understand whether the NPV calculation will be significantly refined after calculating the discount rate using a more accurate method.
After determining the amounts and timing of cash flows, the project manager can estimate what maximum discount rate the project can withstand (NPV criterion = 0). The next section talks about the Internal Rate of Return - IRR.
Internal rate of returnIRR(VSD)
Internal rate of return internal rate of return, IRR (IRR)) is the discount rate at which the Net Present Value (NPV) is equal to 0. The term Internal Rate of Return (IRR) is also used (see. example file, IRR sheet).
The advantage of IRR is that in addition to determining the level of return on investment, it is possible to compare projects of different scales and different durations.
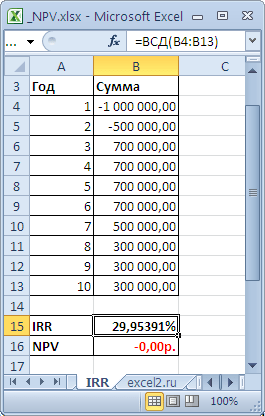
To calculate IRR, the IRR() function is used (English version - IRR()). This function is closely related to the NPV() function. For the same cash flows (B5:B14), the rate of return calculated by the IRR() function always results in a zero NPV. The relationship of functions is reflected in the following formula:
=NPV(VSD(B5:B14),B5:B14)
Note4. IRR can be calculated without the IRR() function: it is enough to have the NPV() function. To do this, you need to use a tool (the “Set in cell” field should refer to the formula with NPV(), set the “Value” field to 0, the “Changing cell value” field should contain a link to the cell with the rate).
Calculation of NPV with constant cash flows using the PS() function
Internal rate of return NET INDOH()
Similar to NPV(), which has a related function, IRR(), NETNZ() has a function, NETINDOH(), which calculates the annual discount rate at which NETNZ() returns 0.
Calculations in the NET INDOW() function are made using the formula:
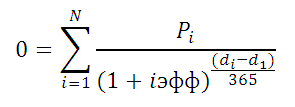
Where, Pi = i-th amount of cash flow; di = date of the i-th amount; d1 = date of 1st amount (starting date to which all amounts are discounted).
Note5. The function NETINDOH() is used for .
Net present value- an indicator that allows you to evaluate the investment attractiveness of a project. Based on the net present value, the investor can understand how justified his initial investment is based on the planned level of profitability of the project, without waiting for its completion.
Net present value: formula
In general, the value of net present value is defined as the sum of all discounted values of future payment streams reduced to today, and is determined as follows:
NPV = - IC + Ʃ CFt/ (1 + r)ᵗ,
NPV - the value of net present value;
IC - initial investment;
CFt - cash flows in a specific period of the project’s payback period, which represent the sum of cash inflows and outflows in each specific period t (t = 1...n);
r - discount rate.
Depending on the value of this indicator, the investor evaluates the attractiveness of the project. If:
1. NPV > 0, then the investment project is profitable, the investor will make a profit;
2. NPV = 0, then the project will bring neither profit nor loss;
3. NPV< 0, проект невыгоден и сулит инвестору убытки.
Taking into account inflation when calculating net present value
Due to the fact that in some situations inflationary fluctuations cannot be leveled out in practice, the question arises of how to reflect the impact of inflation on the net present value indicator. The most common solution to this problem is to adjust the discount to the projected inflation rate.
In this case, the interest rate will be calculated as follows:
R = (1 + r) × J,
R - discount rate taking into account inflation;
r - discount;
J - inflation rate.
Thus, the higher the inflation rate predicted for the duration of the project, the lower the project’s profitability should be so that after discounting the project does not become unprofitable.
Net present value: calculation example
Let's assume that an investor wants to modernize a production process automation system. It is assumed that the cost of re-equipment of the conveyor will be 50,000.00 rubles. At the same time, it is planned to increase production volumes due to new equipment, as a result - an increase in sales volumes over the next 5 years. The cash inflow for the 1st year will be 45,000.00 rubles, for the 2nd year - 40,000.00 rubles, for the 3rd year - 35,000.00 rubles, for the 4th year - 30,000 .00 rub., for the 5th year - 25,000.00 rub. The required rate of return is 10%. Calculation of the present value of the project is presented in the table.
|
Period (t), year |
Cash Flow (CF) |
Discount (r) |
Net Present Value (CFt) |
|
Net present value (NPV)m |
|||
Based on the fact that the NPV indicator is positive, we can conclude that this project is profitable.
However, the situation will change for the worse if we assume that inflation remains at 8% for all 5 years.
|
Period (t), year |
Cash Flow (CF) |
Discount (r) |
Level inflation, (J) |
Net present value (CFt) adjusted for inflation |
|
Net present value (NPV) |
||||
In general, the net present value remained within positive values, which means that the project will still bring profit to investors. However, compared to the first option, where inflation was not taken into account, the return on the initial investment, taking into account the discounted value of proceeds from the sale of new products, became significantly lower.
Results
When deciding on a profitable investment of funds released from business turnover, the investor must make a choice in favor of the most profitable project. Based on the calculation of net present value, it becomes more convenient to compare several options with different payback periods.