The activities of almost any company are subject to risks. To achieve its goals, the company develops predictive financial indicators, including forecasts for revenue, cost, profit, etc. In addition, the company attracts financial resources to implement investment projects. Therefore, the owners expect that the assets will bring additional profit and provide a sufficient level of return on invested capital. (return on equity, ROE):
where NI (net income)- net profit; E (equity) is the equity capital of the company.
However, due to competition in the market, ups and downs of the economy, a situation arises when the actual values of revenue and other key indicators differ significantly from the planned ones. This type risk is called operational (or production) risk (business risk), and it is associated with the uncertainty of obtaining operating income of the company due to changes in the situation on the sales market, falling prices for goods and services, as well as rising tariffs and tax payments. Great impact on production risks in modern economy leads to rapid obsolescence of products. Production risk leads to uncertainty in planning the profitability of the company's assets ( return on assets, ROA):
![]()
where A (assets)– assets; I (interests)- Percentage to be paid. In the absence of debt financing, the interest payable is zero, so the value ROA for a financially independent company is equal to profitability equity (ROE) and a company's production risk is determined by the standard deviation of its expected return on equity, or ROE.
One of the factors affecting the production risk of a company is share of fixed costs in its general operating expenses, which must be paid regardless of how much revenue its business generates. To measure the degree of influence of fixed costs on the company's profits, you can use the indicator of operating leverage, or leverage.
Operating lever (operating leverage) due to the company's fixed costs, as a result of which a change in revenue causes a disproportionate, stronger decrease or increase in the return on equity.
A high level of operating leverage is typical for capital-intensive industries (steel, oil, heavy engineering, forestry), which incur significant fixed costs, such as the maintenance and maintenance of buildings and premises, rental costs, fixed general production costs, communal payments, wage management personnel, property and land tax, etc. The peculiarity of fixed costs is that they remain unchanged and with the growth of production volumes, their value per unit of output decreases (the effect of scale of production). At the same time, variable costs increase in direct proportion to the growth of production, however, per unit of output, they are a constant value. To study the relationship between a company's sales volume, expenses and profit, a break-even analysis is carried out, which allows you to determine how much goods and services need to be sold in order to recover fixed and variable costs. This quantity goods sold and services is called breakeven point (break-even point), and the calculations are carried out within break-even analysis (break-even analysis). The break-even point is the critical value of the volume of production, when the company is not yet making a profit, but is no longer incurring losses. If sales rise above this point, then a profit is formed. To determine the break-even point, first consider Fig. 9.4, which shows how the operating profit of the company is formed.

Rice. 9.4.
The break-even point is reached when the revenue covers operating expenses, i.e. operating profit is zero, EBIT= 0:
where R– selling price; Q- the number of units of production; V- variable costs per unit of production; F- total fixed operating costs.
where is the breakeven point.
Example 9.2. Suppose that the company "Charm", which produces cosmetic products, fixed costs are 3,000 rubles, the price of a unit of goods is 100 rubles, and variable costs are 60 rubles. per unit. What is the breakeven point?
Solution
We will carry out the calculations according to the formula (9.1):
![]()
In Example 9.2, we showed that the company needs to sell 75 units. products to cover their operating expenses. If you manage to sell more than 75 units. product, then its operating profit (and therefore, ROE in the absence of debt financing) will begin to grow, and if it is less, then its value will be negative. At the same time, as is clear from formula (9.1), the break-even point will be the higher, the greater the size of the company's fixed costs. A higher level of fixed costs requires more products to be sold in order for the company to start making a profit.
Example 9.3. It is necessary to conduct a break-even analysis for two companies, data for one of them - "Sharm" - we considered in example 9.2. The second company - "Style" - has higher fixed costs at the level of 6000 rubles, but its variable costs are lower and amount to 40 rubles. per unit, the price of products is 100 rubles. for a unit. The income tax rate is 25%. Companies do not use debt financing, so the assets of each company are equal to the value of their own capital, namely 15,000 rubles. It is required to calculate the break-even point for the company "Style", as well as to determine the value ROE for both companies with sales volumes of 0, 20, 50, 75, 100, 125, 150 units. products.
Solution
First, let's determine the break-even point for the Style company:
![]()
Let's calculate the value of the return on equity of companies for different sales volumes and present the data in Table. 9.1 and 9.2.
Table 9.1
Sharm company
|
Operating costs, rub. |
Net profit, rub., EBIT About -0,25) |
ROE, % NI/E |
|||
Table 9.2
Company "Style"
|
Operating costs, rub. |
Net profit, rub., EBIT (1 -0,25) |
ROE, % NI/E |
|||
Due to Style's higher fixed costs, the break-even point is reached at a higher sales volume, so the owners need to sell more products to make a profit. It is also important for us to look at the change in profit that occurs in response to a change in sales, for this we will build graphs (Fig. 9.5). As you can see, due to lower fixed costs, the break-even point for the company "Sharm" (chart 1) is lower than for the company "Style". For the first company, it is 75 units, and for the second - 100 units. After the company sells products in excess of the break-even point, revenue covers operating costs and additional profit is generated.
So, in the considered example, we have shown that in the case of a higher share of fixed costs in costs, the break-even point is reached with a larger volume of sales. After reaching the break-even point, the profit begins to grow, but as is clear from Fig. 9.4, in the case of higher fixed costs, profit grows faster for Style than for Charm. In the case of a decrease in activity, the same effect occurs, only a decrease in sales leads to the fact that losses grow faster for a company with higher fixed costs. In this way, fixed costs create a leverage that, when production increases or decreases, causes more significant changes in profit or loss. As a result, the values ROE deviate more for companies with higher fixed costs, which increases risk. Using the calculation of the effect of operating leverage, you can determine how much the operating profit will change when the company's revenue changes. Operating leverage effect (degree of operating leverage, DOL) shows by what percentage the operating profit will increase / decrease if the company's revenue increases / decreases by 1%:

where EBIT- operating profit of the company; Q- sales volume in units of production.
At the same time, the higher the share of fixed costs in the company's total operating expenses, the higher the strength of the operating leverage. For a specific volume of production, the operating leverage is calculated by the formula
![]() (9.2)
(9.2)
If the value of the operating leverage (leverage) is equal to 2, then with an increase in sales by 10%, operating profit will increase by 20%. But at the same time, if the sales revenue decreases by 10%, then the company's operating profit will also decrease more significantly - by 20%.

Rice. 9.5.
If the brackets are opened in formula (9.2), then the value QP will correspond to the company's revenue, and the value QV- total variable costs:
![]()
where S- the company's revenue; TVC- total variable costs; F- fixed costs.
If a company has a high level of fixed costs in general expenses, then the value of operating income will change significantly with revenue fluctuations, and there will also be a high dispersion of the return on equity compared to a company that produces similar products, but has a lower level of operating leverage.
The results of the company's activities largely depend on the market situation (changes in GDP, fluctuations in interest rates, inflation, changes in the exchange rate of the national currency, etc.). If the company is characterized by high operating leverage, then a significant proportion of fixed costs enhances the consequences of negative changes in the markets, increases the company's risks. Indeed, variable costs will decrease following the decline in production caused by market factors, but if fixed costs cannot be reduced, then profits will decline.
Is it possible to reduce the level of production risk of the company?
To some extent, companies can influence the level of their operating leverage by controlling the amount of fixed costs. When choosing investment projects, a company can calculate the break-even point and operating leverage for different investment plans. For instance, trade company can analyze two sales options household appliances- v shopping malls or over the Internet. Obviously, the first option involves high fixed rental costs. trading floors, while the second trading option does not involve such costs. Therefore, in order to avoid high fixed costs and the risk associated with them, the company can provide a way to reduce them during the project development stage.
To reduce fixed costs, the company may also switch to subcontracts with suppliers and contractors. The experience of Japanese companies using subcontracting is widely known, in which a significant part of the production of components is transferred to subcontractors, the parent company concentrates on the most difficult technological processes, and fixed costs are reduced due to the withdrawal of individual capital-intensive industries to subcontractors. The importance of managing fixed costs is also related to the fact that their share has a great influence on the financial leverage, on the formation of the capital structure, which we will discuss in the next paragraph.
Operating leverage (production leverage) is a potential opportunity to influence the company's profit by changing the cost structure and production volume.
The effect of operating leverage is that any change in sales revenue always leads to a larger change in profit. This effect is caused by varying degrees of influence of the dynamics of variable costs and fixed costs on the financial result when the volume of output changes. By influencing the value of not only variable, but also fixed costs, you can determine by how many percentage points the profit will increase.
The level or strength of the impact of the operating leverage (Degree operating leverage, DOL) is calculated by the formula:
DOL = MP/EBIT = ((p-v)*Q)/((p-v)*Q-FC)
MP - marginal profit;
EBIT - earnings before interest;
FC - semi-fixed production costs;
Q is the volume of production in physical terms;
p - price per unit of production;
v - variable costs per unit of output.
Marginal profit.
Marginal revenue (marginal income) is the difference between the income received from sales and variable costs. It is a source of covering fixed costs and a source of profit generation.
The level of operating leverage allows you to calculate the percentage change in profit depending on the dynamics of sales by one percentage point. In this case, the change in EBIT will be DOL%.
The greater the share of the company's fixed costs in the cost structure, the higher the level of operating leverage, and hence the greater the business (production) risk.
As revenue moves away from the breakeven point, the operating leverage decreases and the margin financial strength organizations are growing. This feedback is associated with a relative decrease in the fixed costs of the enterprise.
Since many enterprises produce a wide range of products, it is more convenient to calculate the level of operating leverage using the formula:
DOL = (S-VC)/(S-VC-FC) = (EBIT+FC)/EBIT
where S - sales proceeds; VC - variable costs.
The level of operating leverage is not a constant value and depends on a certain, basic implementation value. For example, with a breakeven volume of sales, the level of operating leverage will tend to infinity. The level of operating leverage is greatest at a point just above the breakeven point. In this case, even a slight change in sales leads to a significant relative change in EBIT. The change from zero profit to any profit represents an infinite percentage increase.
In practice, those companies that have a large share of fixed assets and intangible assets (intangible assets) in the balance sheet structure and large management expenses have a large operating leverage. Conversely, the minimum level of operating leverage is inherent in companies that have a large share of variable costs.
Thus, understanding the mechanism of action production leverage allows you to effectively manage the ratio of fixed and variable costs in order to increase the profitability of the company's operations.
The concept of "lever" is widely used in various natural sciences and denotes a device or mechanism that allows you to increase the impact on some object. In financial management, as such a mechanism, you
there is a constant component in the total costs of the enterprise.
Under the operating leverage (OL) understand the share of fixed costs in the costs incurred by the company in the course of its core business. This indicator characterizes the dependence of the enterprise on fixed costs in the cost of production and is an important characteristic of its business risk.
The operating leverage effect is manifested in the fact that any change in sales revenue always generates a stronger change in profit.
If the share of fixed costs in the cost of goods and services is significant, the company has a high level of operating leverage, and hence business risk. For such an enterprise, even a small change in sales volume can lead to a significant change in profits.
In practical calculations, to determine the strength of the impact of operating leverage, the ratio of marginal profit (the result of sales after reimbursement of variable costs) to profit before interest and taxes is used. Given the previously accepted notation, the level or strength of the impact of the operational leverage (degree of operational leverage - DOL) can be expressed as
O x(Pv) MP MP
DOL=-----^-=---=. (10.20) Qx(P-v)-FC MP-FC EBIT K )
The level of operating leverage allows you to determine the percentage change in profit depending on the change in sales by 1%. In this case, the change in EBIT will be DOL%.
It is easy to see that when FC > 0, the denominator in (10.20) is always less than the numerator, and the value of DOL > 1. Thus, a change in revenue by 1% will lead to more significant fluctuations in profit. At the break-even point, the value of the level of operating leverage will tend to infinity. With insignificant deviations of sales volume from the break-even point, there will be a significant change in the profitability of the business, decreasing as it moves away from the critical level.
Since many enterprises produce more than one type of product, it is more convenient to determine the level of operating leverage through cost indicators.
SAL-VC _ EB IT + FC SALVC - FC EBIT y ’
A number of important conclusions follow from the foregoing.
1. With the same total costs, the higher (lower) the share of fixed costs, the higher (lower) the level of operating leverage.
3. The positive impact of the lever begins to manifest itself only after the company has overcome the break-even point of its activities. Achieving break-even is rewarded with profits that rise rapidly with each additional unit sold.
4. As sales increase further and further away from the breakeven point, the effect of leverage decreases. Each subsequent percentage increase in sales leads to an increasing rate of increase in the amount of profit. Accordingly, with any decrease in sales, profits will fall more rapidly.
5. An increase in the share of fixed costs, even with a decrease in variable costs per unit of production, always leads to the need to choose a strategy aimed at increasing sales volumes.
Consider an example.
Example 10.7
In the previous period, the company had a revenue of 1400.00 units. The total variable costs amounted to 800.00 units, and fixed costs - 250.00 units. At the same time, an operating profit of 350.00 units was received. In the next period, it is planned to increase revenue by 15%. How will the planned growth in sales affect the operating profit of the enterprise, other things unchanged?
Let's determine the value of DOL for the base period. According to the original data
1400,00-800,00 1400,00-800,00-600,00 ’ "
Thus, a 1% change in sales volume while maintaining fixed costs at the same level will cause a change in operating profit of 1.714%.
Then a 15% increase in revenue should lead to an increase in operating profit by 1.714 x 15 = 25.71%. Accordingly, its value should be
EU = 350.00 x (1 + 0.2571) = 440.00 units
Let's check our assumption by constructing a forecast income statement in the form shown in Table. 10.2. The calculation results are presented in table. 10.8.
Table J.8
Income Statement Forecast (Example 10.7)
Indicator Actual
units Plan (sales growth by 15%)
Sales revenue (SAL) 1400.00 1610.00 +15.00
Variable costs (VQ 800.00 920.00 + 15.00
Fixed costs (FQ 250.00 250.00 0
Operating profit (EBIT) 350.00 440.00 +25.71
Operating leverage is a metric that helps managers choose the appropriate enterprise strategy for managing costs, profits, and business risk. Its level may change under the influence of the following factors:
Realization price;
Sales volumes;
Variable and fixed costs;
A combination of these factors.
With unfavorable market conditions leading to a decrease in sales, as well as in the early stages of the life cycle of an enterprise, when its break-even point has not yet been overcome, it is necessary to take measures to reduce fixed costs. And vice versa, with favorable market conditions and the presence of a certain margin of financial strength (BM value), the requirements for the regime of saving fixed costs can be significantly weakened. During such periods, the enterprise can significantly expand the volume of investments in new projects and assets, carry out the reconstruction and modernization of fixed assets.
When managing fixed costs, it should be borne in mind that their share largely depends on the industry specifics of the business, which determine various requirements for the capital intensity of production, labor automation, staff qualifications, etc. In addition, fixed costs are less amenable to rapid change. Therefore, enterprises in capital-intensive industries (mining or heavy industry, mechanical engineering, etc.) usually have less ability to manage operating leverage. At the same time, service enterprises can easily adjust the level of operating leverage based on a particular market situation.
Despite these limitations, management has enough ways to influence the total amount and share of fixed costs. These include:
Reduction of selling, general company and administrative expenses in case of unfavorable market conditions;
Sale of part of unused equipment and intangible assets;
Reducing the volume of consumed utilities;
Reviewing the terms of lease payments;
The use of schemes such as subcontracting, outsourcing, etc.
When managing variable costs, the main efforts
management should be aimed at saving them. Its provision before the company overcomes the break-even point leads to an increase in marginal income, which allows you to quickly overcome this point. Further, the amount of savings in variable costs will provide a direct increase in the profit of the enterprise. The main reserves for saving variable costs include:
Decrease in the number of employees of the main and auxiliary industries due to the growth of their labor productivity;
The transition from piece-rate types of wages to time-based;
Reducing stocks of raw materials, supplies and finished products during periods of unfavorable market conditions;
Introduction of resource-saving technologies;
Replacement of materials with cheaper analogues without compromising product quality;
Ensuring favorable conditions for the supply of raw materials and materials for the enterprise, etc.
Correct use of the effect of operating leverage, targeted management of fixed and variable costs, timely change in their ratio under changing business conditions allows increasing the potential for generating profits of the enterprise and reducing its business risk.
We will analyze the operating lever of an enterprise and its impact on production and economic activities, consider the formulas for calculating the price and natural leverage and analyze its assessment using an example.
Operating lever. Definition
Operating lever (operating leverage, production leverage) - shows the excess of the growth rate of profit from sales over the growth rate of the company's revenue. The purpose of the functioning of any enterprise is to increase profits from sales and, accordingly, net profit, which can be directed to improving the productivity of the enterprise and its growth. financial efficiency(value). The use of operating leverage allows you to manage the future profit from the sales of the enterprise by planning future revenue. The main factors that affect the amount of revenue are: product price, variable, fixed costs. Therefore, the goal of management becomes the optimization of variable and fixed costs, the regulation of pricing policy to increase sales profits.
Formula for calculating price and natural operating leverage
|
Formula for calculating price operating leverage |
The formula for calculating natural operating leverage |
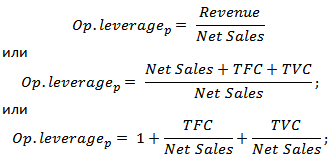 where: Op. leverage p - price operating leverage; Revenue - sales revenue; Net Sales - sales profit (operating profit); TVC (Total variable Costs)
– total variable costs; TFC (Total fixed Costs) where: Op. leverage p - price operating leverage; Revenue - sales revenue; Net Sales - sales profit (operating profit); TVC (Total variable Costs)
– total variable costs; TFC (Total fixed Costs)
|
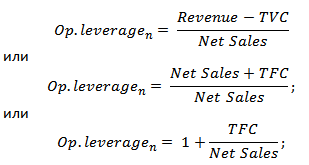 where: Op. leverage n - natural operating leverage; Revenue - sales revenue; Net Sales - sales profit (operating profit); TFC (Total fixed Costs) - total fixed costs. |
What does the operating lever show?
Price operating leverage reflects price risk, that is, the impact of price changes on the amount of profit from sales. shows the production risk, that is, the variability of profit from sales depending on the volume of output.
High operating leverage reflects a significant excess of revenue over sales profit and indicates an increase in fixed and variable costs. The increase in costs may be due to:
- Modernization of existing facilities, expansion of production facilities, increase production staff, introduction of innovations and new technologies.
- Decrease in sales prices of products, inefficient growth in the cost of wages for low-skilled personnel, an increase in the number of defects, a decrease in the efficiency of the production line, etc. This leads to an inability to provide the necessary sales volume and, as a result, reduces the margin of financial safety.
In other words, any costs at the enterprise can be both effective, increasing the production, scientific, technological potential of the enterprise, and vice versa, hindering development.
Operating leverage. How does productivity affect profits?
Operating leverage effect
Operational (production) effect leverage lies in the fact that a change in the company's revenue has a stronger impact on sales profit.
As we can see from the above table, the main factors affecting the size of the operating leverage are variable, fixed costs, and also profit from sales. Let's take a closer look at these leverage factors.
fixed costs- these are costs that do not depend on the volume of production and sale of goods, in practice, they include: rent for production areas, salaries of management personnel, interest on loans, deductions for the unified social tax, depreciation, taxes on property and etc.
Variable costs - these are costs that vary depending on the volume of production and sale of goods, they include the costs of: materials, components, raw materials, fuel, etc.
Sales profit depends primarily on the volume of sales and the pricing policy of the enterprise.
Operational leverage of the enterprise and financial risks
The operating leverage is directly related to the financial strength of the enterprise through the ratio:
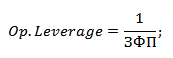
Op. Leverage - operating leverage;
ZPF - a margin of financial strength.
With the growth of the operating leverage, the financial strength of the enterprise decreases, which brings it closer to the threshold of profitability and inability to ensure sustainable financial development. Therefore, the company needs to constantly monitor its production risks and their impact on financial ones.
Consider an example of calculating the operating leverage in Excel. To do this, you need to know the following parameters: revenue, profit from sales, fixed and variable costs. As a result, the formula for calculating the price and natural operating leverage will be as follows:
Price operating leverage=B4/B5
Natural operating lever=(B6+B5)/B5

Example of calculating operating leverage in Excel
Based on the price leverage, it is possible to evaluate the impact of the company's pricing policy on the amount of profit from sales, so if the price of products increases by 2%, the profit from sales will increase by 10%. And with an increase in production volumes by 2%, the profit from sales will increase by 3.5%. Similarly, the opposite is true, with a decrease in price and volume, the resulting value of profit from sales will decrease in accordance with the leverage.
Summary
In this article, we examined the operating (production) lever, which allows us to evaluate the profit from sales, depending on the pricing and production policy of the enterprise. High leverage values increase the risk of a sharp reduction in the company's profits in an unfavorable economic situation, which, as a result, can bring the company closer to the break-even point, when profits equal losses.
At the heart of the change in the effect of the production lever is the change specific gravity fixed costs in the total cost of the enterprise. At the same time, it should be borne in mind that the sensitivity of profit to changes in sales volume can be ambiguous in organizations with a different ratio of fixed and variable costs. The lower the share of fixed costs in the total cost of the enterprise, the more the amount of profit changes in relation to the rate of change in sales proceeds.
The value of the operating (production) leverage may vary under the influence of: price and sales volume; variable and fixed costs; combinations of any of the above factors.
It should be noted that in specific situations, the manifestation operating lever mechanism has a number of features that must be considered in the process of its use. These features are as follows:
1. The positive impact of the production lever begins to manifest itself only after the enterprise has overcome the break-even point of its activity, i.e. the enterprise must first earn enough marginal income to cover its fixed costs. This is due to the fact that the company is obliged to reimburse its fixed costs regardless of the specific sales volume, therefore, the higher the amount of fixed costs, the later, all other things being equal, it will reach the break-even point of its activities.
In this regard, until the enterprise has ensured the break-even of its activities, a high level of fixed costs will be an additional negative factor on the way to reaching the break-even point.
2. As sales increase further and move away from the breakeven point, the effect of production leverage begins to decline. Each subsequent percentage increase in sales will lead to an increasing rate of increase in the amount of profit.
3. The mechanism of production leverage also has the opposite direction - with any decrease in sales volume, more the company's profit will decrease.
Operating lever force, as already noted, depends on relative magnitude fixed costs, which are difficult to reduce with a decrease in the income of the enterprise. The high impact force of the operating lever in conditions of economic instability, the fall in the effective demand of consumers means that each percentage of the decline in revenue leads to a significant drop in profits and the possibility of the company entering the zone of losses.
If we define the risk of a particular enterprise as an entrepreneurial risk, then we can trace the following relationship between the strength of the operating leverage and the degree of entrepreneurial risk: with a high level of fixed costs of the enterprise and the absence of their reduction during the period of falling demand for products, entrepreneurial risk increases.
Small firms specializing in the production of one type of product are characterized by a high degree of entrepreneurial risk. The instability of demand and prices for finished products, prices for raw materials and energy resources acts in the same direction.
In this way, modern management costs involves quite diverse approaches to accounting and analysis of costs, profits, entrepreneurial risk. You have to master these interesting tools to ensure the survival and development of your business.
Understanding the essence of the operating lever and the ability to manage it is additional features to use this tool in the investment policy of the company. Thus, production risk in all industries can be regulated to a certain extent by managers, for example, when choosing projects with higher or lower fixed costs. With the release of products with a high market capacity, with the confidence of managers in sales volumes that significantly exceed the break-even point, it is possible to use technologies that require high fixed costs, implement investment projects for the installation of highly automated lines, and other capital-intensive technologies. In the areas of activity, when the company is confident in the possibility of conquering a stable market segment, as a rule, it is advisable to implement projects that have a lower proportion of variable costs.
Summing up, we can say:
- an enterprise with a greater operational risk takes more risks in the event of a deterioration in market conditions, and at the same time it has advantages in the event of an improvement in the market situation;
- the enterprise must navigate the market situation and adjust the cost structure accordingly.
Cost management in connection with the use of the effect of operating leverage allows you to quickly and comprehensively approach the use of enterprise finances. For this you can use 50/50 rule. All types of products are divided into two groups depending on the share of variable costs. If it is more than half, then it is more profitable for the given types of products to work on reducing costs. If the share of variable costs is less than 50%, then it is better for the company to increase sales volumes - this will give more gross margin.
Fomina Irina Alexandrovna
professor of St. Petersburg state university civil aviation,
Candidate of Economic Sciences, Associate Professor 196210, St. Petersburg, st. Pilotov, 38
Pie Anna Igorevna
Vorontsova Alexandra Mikhailovna
postgraduate student of St. Petersburg State University
civil aviation 196210, St. Petersburg, st. Pilotov, 38
ECONOMICS AND MANAGEMENT
N 3 (65) 201
The article deals with the issues of management accounting in order to improve the activities of the enterprise. The authors come to the conclusion that in order to solve this problem and more effective management profit, it is necessary to calculate the final performance indicators of the enterprise on the basis of the marginal approach, which is demonstrated by the example of UTair airline.
The marginal approach is an integral part of managerial decision-making at enterprises various areas activities.
Comprehensive performance assessment economic activity characterizes the level and dynamics of the final performance indicators of the enterprise.
According to the purpose of any commercial activities these totals are sales revenue and profit.
Margin analysis (break-even analysis) is widely used in countries with developed market relations. It allows you to study the dependence of profit on a small circle of the most important factors and, on the basis of this, manage the process of forming its value.
The main features of marginal analysis are to determine:
break-even sales volume (profitability threshold, cost recovery) at given price ratios, fixed and variable costs;
security zones (break-even) of the enterprise;
the required volume of sales to obtain a given amount of profit;
critical level of fixed costs at a given level of marginal income;
critical selling price for a given sales volume and the level of variable and fixed costs.
With the help of marginal analysis, other management decisions: select change options production capacity, equipment options, production technology, purchase of components, evaluation of the effectiveness of accepting an additional order, product range, prices for a new product, etc.
In modern conditions, Russian enterprises issues of mass regulation and profit dynamics come to one of the first places in the management of financial resources. The solution of these issues is included in the scope of operational (production) financial management.
The basis of financial management is financial economic analysis, during which the analysis of the cost structure is of paramount importance.
It is known that entrepreneurial activity associated with many factors influencing its result, which are usually divided into two groups. The first group of factors is associated with profit maximization through pricing policy, product profitability, and its competitiveness. The second group of factors is associated with the identification of critical indicators in terms of the volume of products sold, the best combination of marginal revenue and marginal costs, with the division of costs into variable and fixed.
Analysis production costs allows you to determine their impact on the amount of profit from sales, but if you go deeper into these problems, then the following is revealed.
This division:
helps to solve the problem of increasing the mass of profits due to the relative reduction of certain costs;
allows you to search for the optimal combination of variable and fixed costs, providing an increase in profits;
allows you to judge the cost recovery and financial stability in case of deterioration of the economic situation.
The following indicators can serve as a criterion for choosing the most profitable products:
gross margin per unit of production;
the share of gross margin in the price of a unit of production;
gross margin per unit of limited factor.
Considering the behavior of variable and fixed costs, one should analyze the composition and structure of costs per unit of output in a certain period of time and with a certain number of sales. The behavior of variable and fixed costs when the volume of production changes is characterized as follows (Table 1).
Table 1. The behavior of fixed and variable costs with a change in the volume of production
The cost structure is not so much a quantitative relationship as a qualitative one. Nevertheless, the impact of the dynamics of variable and fixed costs on the formation of financial results with a change in production volume is very significant. The concept of operating leverage is closely related to the cost structure.
An analysis of the dynamics of sales proceeds and profits of enterprises shows that a change in sales proceeds causes a stronger change in profit. This effect is called production (operational) leverage.
A number of indicators are used to calculate the effect, or force, of leverage. This requires the separation of costs into variables and constants with the help of an intermediate result. This value is usually called the gross margin (coverage amount, contribution).
These metrics include:
gross margin = profit from sales + fixed costs;
contribution (coverage amount) = sales proceeds - variable costs;
the strength of the impact of the operating lever = (sales proceeds - variable costs) / profit from sales;
operating leverage effect = profit growth rate/revenue growth rate.
If we interpret the effect of the operating leverage as a change in the gross margin, then its calculation will allow us to answer the question of how much the profit changes from an increase in the volume (production, sales) of products.
There is a direct relationship between the value of the production (operating lever) and the ratio of fixed and variable costs:
1) the value of the leverage is greater, the higher the level of the ratio of fixed costs to variables;
2) the value of the leverage is the smaller, the lower the level of the ratio of fixed costs to variables. The calculation of the effect of operating leverage in the system of marginal analysis of UTair's activities is presented in Table. 2.
Table 2. Calculation of the threshold of profitability, margin of financial strength, the strength of the impact of the operating leverage of UTair airline
| Indicators | unit of measurement | Year | ||
| 2008 | 2007 | 2006 | ||
| Total revenue | Thousand rub. | 16 974 418 | 12 110 492 | 8 320 060 |
| Costs are variable | Thousand rub. | 10 211334 | 7 432 199 | 4 508 407 |
| Gross Margin (B - VC) | Thousand rub. | 6 763 084 | 4 678 293 | 3 811653 |
| Gross margin ratio (VM/V) | 0,4 | 0,37 | 0,5 | |
| Profitability Threshold (FC/KBM) | Thousand rub. | 9 293 071 | 8 697 659 | 6 257 244 |
| ZFP (V - PR) | Thousand rub. | 7 681 347 | 3 412 833 | 2 062 816 |
| Profit (ZFP KVM) | Thousand rub. | 3 060 464 | 1 318 380 | 945 034 |
| Impact force 0R | 2,2 | 3,5 | 4,0 | |
| Profitability of sales (P/V 100%) | % | 18,0 | 10,9 | 5,6 |
| Profitability of production (P/R 100%) | % | 29,9 | 17,7 | 20,9 |
Source: the table was compiled based on the author's calculations based on data from the UTair Aviation website: www.utair.ru. Note: B - proceeds from the sale of aviation services; VC - variable costs; FC - fixed costs; VM - gross margin; KVM - gross margin ratio; ZFP - margin of financial strength; PR - profitability threshold; OR - operating lever; P - operating profit; R - operating costs.
Analysis of the data obtained shows that the company's revenue is above the threshold of profitability. In turn, this indicates that the profitability threshold was overcome for all analyzed periods and the airline is in the profit zone, i.e., it receives profit from its main activities.
It can also be seen that the gross margin provides coverage of fixed costs and forms the profit of the enterprise both in 2008 and in 2007 and 2006.
The margin of financial strength shows that even if the airline had a drop in revenue by 7,681,347 thousand. rub. [Ibid.], then the UTair group could have endured this before suffering losses. Similarly for 2007 and 2006. It can be seen that in 2006 the margin of financial safety, although it existed, was insignificant, which indicated a warning about the danger. However, by 2008, the so-called "safety cushion" was formed - due to an increase in the margin of financial strength. It is reasonable to say that the degree of risk is getting lower every year.
According to the results of the operating leverage indicator, it can be judged that the sales revenue is increasing, therefore, the impact of the operating leverage is decreasing. Each percentage increase in revenue results in less and less operating leverage. Based on the foregoing, it can be concluded that the degree of entrepreneurial risk is decreasing, since the strength of the impact of the operating lever decreases every year.
Thus, based on the performed marginal analysis, we can speak about the successful operation of UTair Aviation in the air transportation market.
There are other, more complex, modifications of the formula for calculating the effect of operating leverage, which differ from the one presented by us. However, despite the differences in the algorithms for determining the effect of operating leverage, the content of the operating profit management mechanism by influencing the ratio of fixed and variable costs of an enterprise remains unchanged.
In specific situations of the operating activity of the enterprise, the manifestation of the operating leverage mechanism has a number of features that must be taken into account in the process of its use for profit management. Let's formulate the main ones.
1. The positive impact of operating leverage begins to manifest itself only after the company has overcome the break-even point of its operating activities.
2. After breaking the break-even point - the higher the operating leverage ratio, the greater the impact on profit growth will be the company, increasing the volume of sales.
3. The greatest positive impact of operational leverage is achieved in the field as close as possible to the break-even point (after it has been overcome).
4. The mechanism of operating leverage also has the opposite direction - with any decrease in the volume of sales of products, the size of gross operating profit will decrease even more.
5. The effect of operating leverage is stable only in the short term.
This is determined by the fact that operating costs, which are classified as fixed, remain unchanged only for a short period of time. As soon as in the process of increasing the volume of sales of products there is another jump in the amount of fixed operating costs, the company needs to overcome a new break-even point or adapt its operating activities to it. In other words, after such a jump, which causes a change in the operating leverage ratio, its effect manifests itself in a new way in the new business conditions.
Understanding the mechanism of manifestation of operating leverage allows you to purposefully manage the ratio of fixed and variable costs in order to increase the efficiency of operating activities. This control comes down to changing the value of the operating leverage ratio for various commodity market trends and stages life cycle enterprises.
In case of unfavorable commodity market conditions, which determine a possible decrease in the volume of sales of products, as well as in the early stages of the life cycle of an enterprise, when it has not yet overcome the break-even point, it is necessary to take measures to reduce the value of the operating leverage ratio. And vice versa, if the commodity market is favorable and there is a certain margin of safety (margin of safety), the requirements for the implementation of the fixed cost savings regime can be significantly weakened - during such periods, the enterprise can significantly expand the volume of real investments by reconstructing and modernizing production fixed assets.
Operating leverage can be managed by influencing both fixed and variable operating costs.
When managing fixed costs, it should be borne in mind that their high level is largely determined by the industry specifics of the implementation of operating activities, which determine the different level of capital intensity of manufactured products, the differentiation of the level of mechanization and automation of labor.
It should be noted that fixed costs are less amenable to rapid change, so enterprises with a high operating leverage ratio lose flexibility in managing their costs. Despite these objective limitations, if necessary, each enterprise has enough opportunities to reduce the amount and proportion of fixed operating costs.
Such reserves include a significant reduction in overhead costs (management costs) in case of unfavorable commodity market conditions; sale of part of unused equipment and intangible assets in order to reduce the flow of depreciation charges; widespread use of short-term forms of leasing machinery and equipment instead of acquiring them as property; reduction in the volume of a number of consumed utilities and some others.
When managing variable costs, the main guideline should be to ensure their constant savings, since there is a direct relationship between the amount of these costs and the volume of production and sales of products. Providing these savings before the company overcomes the break-even point leads to an increase in the amount of marginal profit, which allows you to overcome this point faster.
After breaking the break-even point, the amount of savings in variable costs will provide a direct increase in gross operating profit. The main reserves for saving variable costs include:
reduction in the number of employees of the main and auxiliary industries by ensuring the growth of their labor productivity;
reduction of stocks of raw materials, materials, finished products during periods of unfavorable commodity market conditions;
provision of favorable conditions for the supply of raw materials and materials for the enterprise, and others. Purposeful management of fixed and variable costs, prompt change in their ratio under changing business conditions can increase the potential for the formation of the operating profit of the enterprise.
Operating leverage is an indicator that answers the question of how many times the rate of change in sales profit exceeds the rate of change in sales revenue. In other words, when planning an increase or decrease in sales revenue, using the operating leverage indicator allows you to simultaneously determine the increase or decrease in profit. Conversely, if in the planning period the company needs a certain amount of profit from sales, using the operating lever, you can determine what sales revenue will provide the desired profit.
The mechanism for applying operating leverage depends on what factors affect the change in sales revenue in the planning period compared to the base period: price dynamics, or dynamics of natural sales volume, or both factors together.
As a rule, in practice, revenue increases or decreases under the influence of the simultaneous action of both factors. But when planning profits, the degree and direction of impact on the revenue of each factor are of paramount importance.
The dynamics of sales proceeds as a result of a decrease or increase in prices for sold products (works, services) affects the amount of profit differently than the dynamics of proceeds as a result of an increase or decrease in the natural volume of sales.
If the change in demand for products is expressed only through price changes, and the natural volume of sales remains at the basic level, then the entire amount of the increase or decrease in sales proceeds simultaneously becomes the amount of increase or decrease in profit.
If the basic prices are maintained, but the natural volume of sales changes, then the increase or decrease in profit is the sum of the increase or decrease in revenue, reduced by the corresponding change in the value of variable costs.
Consequently, the change in prices is more reflected in the dynamics of profit from sales than the change in the natural volume of sales. It has already been said that the operating lever is a measure of the excess of the rate of profit dynamics over the rate of revenue dynamics.
Thus, even without making any calculations, we can state the following: the indicator of operating leverage with a change in revenue only due to prices will always be higher than with a change in revenue only due to the natural volume of sales.
Based on the foregoing, it can be concluded that it is expedient to use the marginal approach when calculating the final performance indicators of an airline in order to make informed management decisions.
Literature
1. Galitskaya S.V. Financial management. The financial analysis. Moscow: Eksmo, 2009.
2. Campbell M. R., Brew S. L. Economics: Principles, problems and politics. In 2 vols. T. 2. / Per. from English. M.: Respublika, 1992.
3. Karpova G. A. Analysis of financial stability commercial organizations// http://www.gasu.ru/vmu/archive.
4. Kovalev A. I., Privalov V. P. Analysis financial condition enterprises. Moscow: Center for Economics and Marketing, 2001.
5. http://www.utair.ru.
6. Savitskaya GV Analysis of economic activity of the enterprise. M.: LLC "New knowledge", 2009.
7. Sheremet AD Management accounting: Proc. allowance. M.: ID FBK-PRESS, 2000.